Why Your Electricity Bill Keeps Rising: A Data-Driven Look at Energy Supply Costs
Electricity prices are rising because the cost of building, maintaining, and operating the power system has reset higher. The pressure starts with infrastructure, materials, equipment, supplies, labor, fuel, logistics, insurance, and financing. Over time, those higher costs move through utility budgets, contractor bids, rate cases, riders, and customer project charges until they show up on monthly bills.
By GridZero Energy Team | May 26, 2026 | Energy Insights
2025-2026 Snapshot
The cost pressure is real and it is still moving through the system
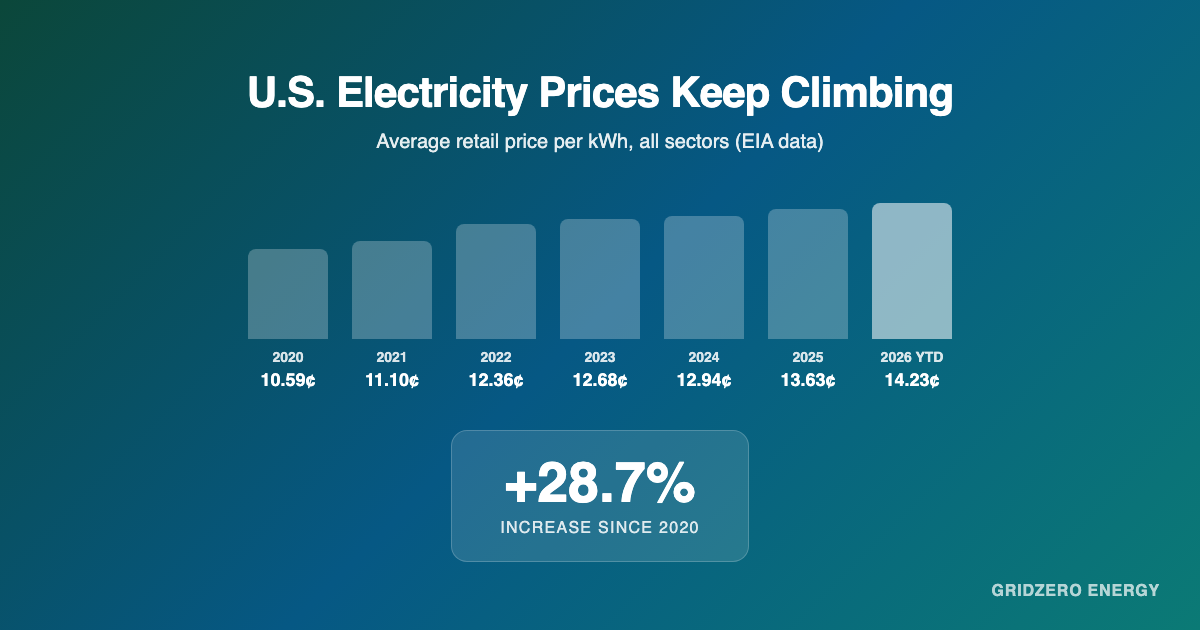
Since 2020, the average U.S. retail electricity price has climbed from 10.59 cents/kWh to 13.63 cents/kWh—a 28.7% increase. Early 2026 data shows the trend continuing. The important point is not just that prices went up. It is that many of the inputs behind electricity delivery went up at the same time. Utilities still need transformers, conductors, poles, substations, crews, trucks, software, fuel, and replacement parts. When those inputs cost more, the delivered cost of power has to catch up.
U.S. average retail electricity price trend (all sectors, cents/kWh)
2020
10.59
2021
11.10
2022
12.36
2023
12.68
2024
12.94
2025
13.63
2026 YTD
14.23
From 2020 to 2025, the U.S. all-sector average retail price of electricity moved from 10.59 cents/kWh to 13.63 cents/kWh. Early 2026 is running higher again. That does not mean every customer sees the same increase, but it does show the direction of the delivered cost stack.
Key 2026 electricity price levels (EIA)
- All sectors (March 2026): 14.18 cents/kWh
- Residential (March 2026): 18.83 cents/kWh
- All sectors (2026 YTD): 14.23 cents/kWh
Cost categories still showing pressure
- Transformer costs remain elevated versus the 2020 baseline.
- Distribution equipment and field-construction costs remain above broad inflation benchmarks.
- Retail electricity prices in early 2026 are above 2025 levels.
Homes
Residential electricity prices in March 2026 were 10.2% higher than March 2025. Delivery-system costs become part of the fixed and per-kWh charges on the bill.
Businesses
Commercial electricity pricing in March 2026 was 5.8% above March 2025. Demand charges, riders, and facility upgrades can make the impact feel uneven from one business to another.
Project budgets
High equipment and labor costs affect service upgrades, interconnections, backup systems, solar, storage, and any project that depends on electrical infrastructure.
How Costs Reach Your Bill
How higher infrastructure costs become higher energy bills
Most homeowners never buy a distribution transformer or a bucket truck. But you still pay for them indirectly because those assets are required to deliver electricity to your home. The pass-through is usually delayed and spread out, but it is real.
- Suppliers raise prices. Steel, copper, aluminum, electrical steel, concrete, oil-filled components, controls, meters, batteries, and fuel become more expensive.
- Contractors and utilities rebid projects. Higher material costs combine with skilled-labor shortages, longer lead times, fleet costs, freight, and contingency.
- Utilities place new costs into the system. Capital equipment becomes rate-base investment, while maintenance, storm response, labor, insurance, and logistics become operating expense.
- Regulators or rate structures allow recovery. Base rates, riders, fuel and purchased-power adjustments, demand charges, line-extension fees, and interconnection charges recover those costs over different time frames.
- Customers see the blended result. The increase may show up as a higher per-kWh price, a larger fixed charge, a demand-charge increase, a rider, a project quote, or a service-upgrade cost.
Capital costs move slowly
Transformers, poles, wires, substations, meters, generation assets, and grid-control systems are usually recovered over years or decades. When replacement costs rise, future rate-base recovery rises with them.
Operating costs move faster
Crew labor, overtime, vegetation management, fleet fuel, maintenance, insurance, and purchased power can affect rates and riders sooner. These are the costs customers often feel before long-cycle capital projects are fully reflected.
5-Year Cost Map
Cost ranges since 2020
The ranges below show why the pressure is broad. A utility bill is connected to a large physical system, not just the wholesale price of electricity. If poles, conductors, transformers, fleet vehicles, labor, fuel, and financing all move higher, the cost of keeping the grid reliable moves higher too.
Grid Infrastructure
- Utility poles (wood, steel, composite): +25-40%
- Crossarms & braces (steel/wood): +20-35%
- Conductor wire (aluminum/copper): +30-50%
- Transformers: +70-100%
- Grain-oriented electrical steel: +80-100%
- Oil/dielectric fluids: +25-40%
- Copper wiring: +50%
- Concrete: +25-35%
- Smart meters: +20-35%
- Pad-mounted switchgear: +25-40%
- Circuit breakers/reclosers: +20-35%
Construction & Build-outs
- Utility construction labor: +20-40%
- Freight/logistics: +30-60%
Communications Infrastructure
- Fiber-optic cable: +25-40%
- Splicing & telecom gear: +20-30%
Generation
- Diesel gensets: +20-40%
- Gas turbines: +20-30%
- Solar PV systems: +25-35%
- Wind turbines: +25-35%
- Hydropower components: +20-30%
- Battery storage: +25-40%
- SCADA/EMS systems: +20-30%
- Inverters: +20-30%
- Relays & switchgear: +25-40%
- Natural gas: +20-120%
- Coal: +30-60%
- Diesel/fuel oil: +40-70%
Utility Fleets
- Light trucks: +25-40%
- Bucket trucks, digger derricks: +20-50%
- Fuel costs (especially diesel): +20-30%
- Maintenance: +15-25%
- Insurance premiums: +20%
Key benchmarks: 2020 to 2025
These benchmarks help put the current rate pressure in context. The retail price of electricity has risen materially, but some behind-the-scenes grid inputs have risen even faster.
- BLS CPI electricity (annual average): +36.1%
- BLS PPI transformer manufacturing (annual average): +73.4%
- BLS PPI electric power distribution (annual average): +31.9%
- EIA average retail electricity price (all sectors): 10.59 to 13.63 cents/kWh (+28.7%)
Sources
- U.S. EIA Electric Power Monthly, Table ES1.A (March 2026 vs March 2025 comparisons)
- U.S. EIA Electric Power Monthly, Table 5.3 (annual and year-to-date price trend context)
- U.S. BLS Public Data API v2 series used:
CUUR0000SEHF01,PCU335311335311,PCU221122221122,WPU117(latest monthly values through April 2026 where available) - Additional industry range context compiled from published market reporting across utility equipment, labor, fuel, and logistics categories.
What This Means for You
Higher grid costs make energy independence more valuable
Every item on the cost map above eventually finds its way into your monthly bill, your service upgrade quote, or your interconnection fee. The grid is not getting cheaper to maintain. As equipment ages, storms become more frequent, and labor and materials stay elevated, the upward pressure on rates is likely to continue.
For homeowners and businesses in North Idaho, this creates a clear choice: keep accepting annual rate increases from a system with rising maintenance costs, or invest in a solar and storage system that locks in your energy costs and reduces dependence on the grid.
GridZero designs off-grid and grid-tied solar systems sized for your actual energy use, your property, and your budget. We handle permitting, installation, and ongoing support so you can focus on using your power—not worrying about the next rate case.
Ready to take control of your energy costs?
Get a free consultation to compare your current utility costs against solar and storage options. We’ll look at your usage, your property, and your goals—then show you what energy independence actually looks like for your situation.